Environment for creative processing of text and numerical data |  |
Environment for creative processing of text and numerical data | |
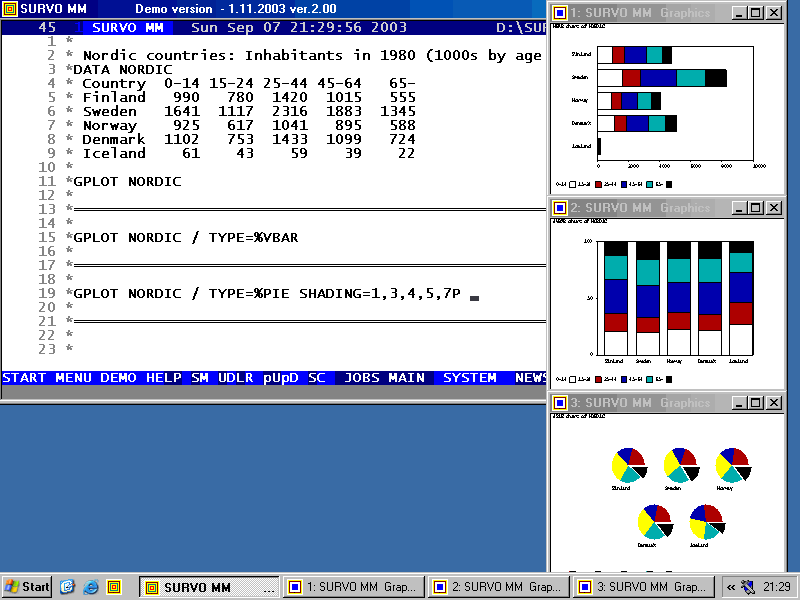
   1 *
   2 * Nordic countries: Inhabitants in 1980 (1000s by age groups)
   3 *DATA NORDIC
   4 * Country  0-14 15-24 25-44 45-64   65-
   5 * Finland   990   780  1420  1015   555
   6 * Sweden   1641  1117  2316  1883  1345
   7 * Norway    925   617  1041   895   588
   8 * Denmark  1102   753  1433  1099   724
   9 * Iceland    61    43    59    39    22
  10 *
  11 *GPLOT NORDIC
  12 *
  13 *........................................................................
  14 *
  15 *GPLOT NORDIC / TYPE=%VBAR
  16 *
  17 *........................................................................
  18 *
  19 *GPLOT NORDIC / TYPE=%PIE SHADING=1,3,4,5,7P
  20 *
  21 *........................................................................
  22 *


Each activation of the GPLOT command plots a graph in its own graphics window. The default setting is three windows below each other. The settings can be freely modified even for single graphs.