Environment for creative processing of text and numerical data |  |
   1 *
   2 *Curve plotting 1:
   3 *
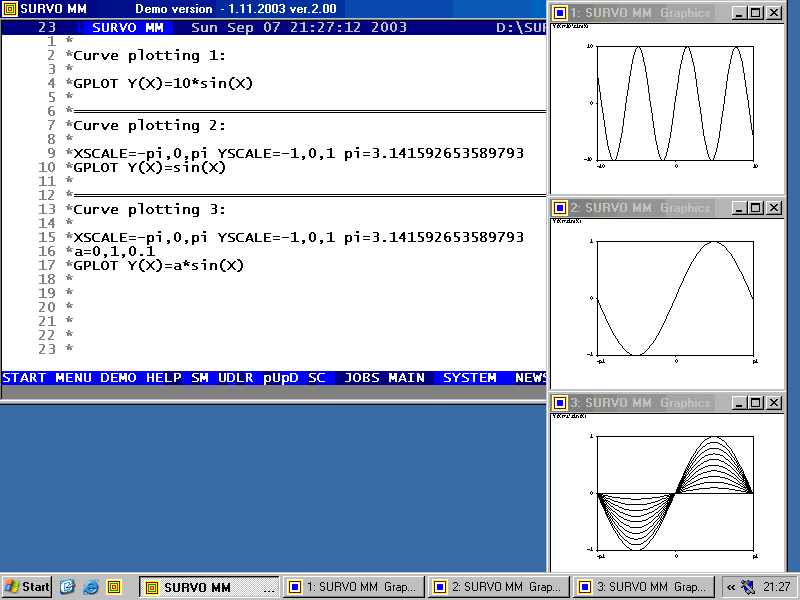
   4 *GPLOT Y(X)=10*sin(X)
   5 *
   6 *........................................................................
   7 *Curve plotting 2:
   8 *
   9 *XSCALE=-pi,0,pi YSCALE=-1,0,1 pi=3.141592653589793
  10 *GPLOT Y(X)=sin(X)
  11 *
  12 *........................................................................
  13 *Curve plotting 3:
  14 *
  15 *XSCALE=-pi,0,pi YSCALE=-1,0,1 pi=3.141592653589793
  16 *a=0,1,0.1
  17 *GPLOT Y(X)=a*sin(X)
  18 *


Each activation of the GPLOT command plots a graph in its own graphics window. The default setting is three windows below each other. The settings can be freely modified even for single graphs.
