Environment for creative processing of text and numerical data |  |
S.Mustonen, Survo Users' Guide (1992), p. 248

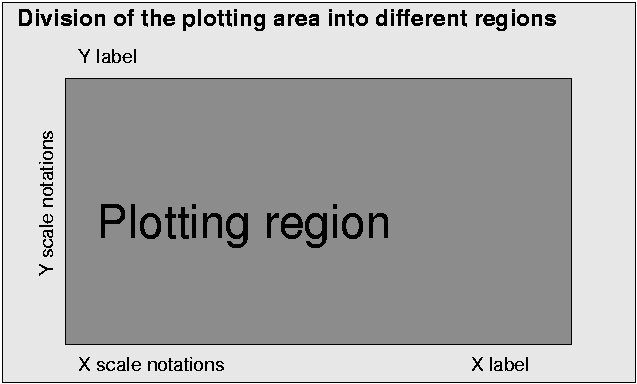
1 * 2 *PLOT /FRAME/ DEVICE=PS,EX.PS 3 *HEADER=[Swiss(12)],Division_of_the_plotting_area_into_different_regions4 * 5 *SIZE=W,H W=1164 H=700 Width and Height of the graph 6 *XDIV=X1,X2,X3 X1=0.1*W X2=0.8*W X3=W-X1-X2 X division 7 *YDIV=Y1,Y2,Y3 Y1=0.1*H Y2=0.7*H Y3=H-Y1-Y2 Y division 8 *PEN=[Swiss(10)][rot(0)] sets the default font. [rot(0)]=texts horizontal 9 * 10 *TEXTS=T1,T2,T3,T4,T5 11 *T1=[Swiss(24)],Plotting_region,1.5*X1,Y1+0.4*Y2 12 *T2=X_scale_notations,1.2*X1,0.3*Y1 13 *T3=[rot(90)],Y_scale_notations,0.8*X1,0.4*Y2 in vertical direction 14 *T4=X_label,X1+0.8*X2,0.3*Y1 T5=Y_label,1.2*X1,H-0.8*Y3 15 * 16 *FRAMES=F1,F2 17 *F1=0,0,W,H,1 Entire graph painted in light gray 18 *F2=X1,Y1,X2,Y2,4 Plotting region painted in darker gray 19 *
Index | Catalog | Previous | Next