Environment for creative processing of text and numerical data |  |
F.Åberg (1996)

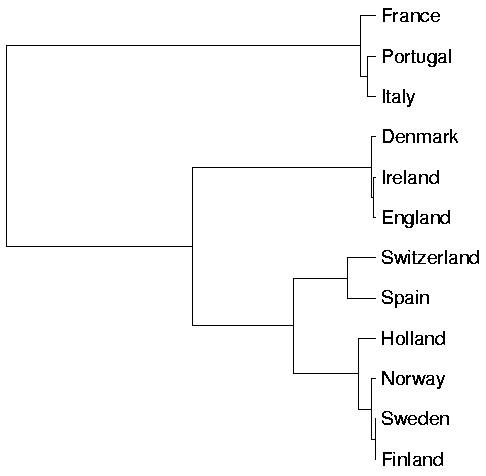
1 * 2 *DATA COUNTRIES A,B,N 3 *Consumption of various beverages in 12 European countries 4 * 5 N Country Coffee Tea Beer Wine Spirits 6 A Denmark 11.8 0.41 113.9 10.4 1.7 7 * England 1.8 3.49 113.7 5.1 1.4 8 * Finland 12.5 0.15 54.7 7.6 2.7 9 * France 5.2 0.10 44.5 104.3 2.5 10 * Holland 9.2 0.58 75.5 9.7 2.7 11 * Ireland 0.2 3.73 124.5 3.8 1.9 12 * Italy 3.6 0.06 13.6 106.6 2.0 13 * Norway 9.4 0.19 43.5 3.1 1.8 14 * Portugal 2.2 0.03 27.5 89.3 0.9 15 * Spain 2.5 0.03 43.6 73.2 2.7 16 * Sweden 12.9 0.30 58.3 7.9 2.9 17 B Switzerland 9.1 0.25 73.5 44.9 2.1 18 * 19 *HCLUSTER COUNTRIES,CUR+4/ METHOD=COMPLETE PLOT=PS 20 * 21 *Lines below are written by the HCLUSTER operation:22 * 23 * Hierarchical cluster analysis of observations in COUNTRIES N=12 24 * Method : Complete_linkage Distance : Squared_Euclidian 25 *....................................................................... 26 * Activate the line below to plot the tree to file #TREE#.PS 27 *PLOT #TREE#,X,Y28 * Change YSCALE and XSCALE below to plot subtrees. 29 * YSCALE=1,12 POINT=Label FRAME=0 XLABEL= <-_Distance 30 * XSCALE=-22900/1,0 PEN=[Swiss(12)] MODE VGA YLABEL= 31 * Change LINE spec. below to 1 for a 'triangular' tree. 32 * LINE=3 XDIV=100,816,100 YDIV=100,980,200 33 * HEADER= [Swiss(18)],Complete_linkage;_Input:_COUNTRIES 34 * DEVICE=PS,#TREE#.PS SIZE=1016,1280 HOME=100,1620 35 *....................................................................... 36 * Stage Cluster 1 Cluster 2 Distance 37 * 1 Finland Sweden 13.27249 38 * 2 England Ireland 121.1977 39 * 3 GROUP 1 Norway 255.5521 40 * 4 Denmark GROUP 2 301.5424 41 * 5 Italy Portugal 495.6707 42 * 6 France GROUP 5 962.9116 43 * 7 GROUP 3 Holland 1068.562 44 * 8 Spain Switzerla 1738.868 45 * 9 GROUP 7 GROUP 8 5095.052 46 * 10 GROUP 4 GROUP 9 11380.79 47 * 11 GROUP 10 GROUP 6 22891.69 48 *
Index | Catalog | Previous | Next