Environment for creative processing of text and numerical data |  |
S.Mustonen (1994)

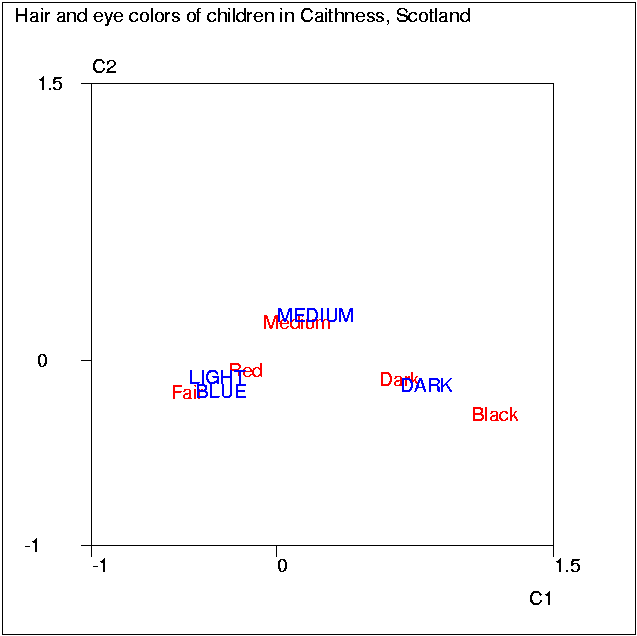
1 *SAVE COLORS / Fisher 1940 (CORRESP) 2 *Correspondence analysis (Fisher's example from 1940): 3 *DATA COLORS,A,B,N,M 4 M ------ AAA AAA AAA AAA CC.CC CC.CC 5 N Color BLUE LIGHT MEDIUM DARK C1 C2 6 A Fair 326 688 343 98 -0.54 -0.17 7 * Red 38 116 84 48 -0.23 -0.05 8 * Medium 241 584 909 403 -0.04 0.21 9 * Dark 110 188 412 681 0.59 -0.10 10 B Black 3 4 26 85 1.09 -0.29 11 * 12 *CORRESP COLORS,END+2/ results of analysis in the end of the edit field 13 * 14 *........................................................................ 15 * 16 *Plot the dimensions in the graphics window: 17 * 18 *OUTFILE=A INFILE=A SCALE=-1,0,1.5 19 *MODE=640,480 XDIV=180,380,80 YDIV=60,380,40 20 *HEADER=Hair_and_eye_colors_of_children_in_Caithness;_Scotland 21 * 22 *GPLOT /FIX/ create transparent plots in the same window 23 *GPLOT COLORS,C1,C2/ POINT=[RED],Color INFILE=NULL 24 *GPLOT CR_COORD.M,C1,C2/ POINT=[BLUE],CASE 25 *GPLOT /NEXT/ release the fix done above 26 * 27 *........................................................................ 28 * 29 *Correspondence analysis on data COLORS: Rows=5 Columns=4 30 * 31 * Canonical Eigen- Chi^2 Cumulative 32 * correlation value percentage 33 * 1 0.4464 0.1992 1073.33148 86.56 34 * 2 0.1735 0.0301 162.077452 99.63 35 * 3 0.0293 0.0009 4.63002608 100.00 36 * 0.2302 1240.04 (df=12 P=0) 37 * 38 *Column coordinates (CR_COORD.M) 39 * C1 C2 40 *BLUE -0.400 -0.165 41 *LIGHT -0.441 -0.088 42 *MEDIUM 0.034 0.245 43 *DARK 0.703 -0.134 44 * 45 *
Index | Catalog | Previous | Next