Environment for creative processing of text and numerical data |  |
K.Vehkalahti (1996)

   1 *
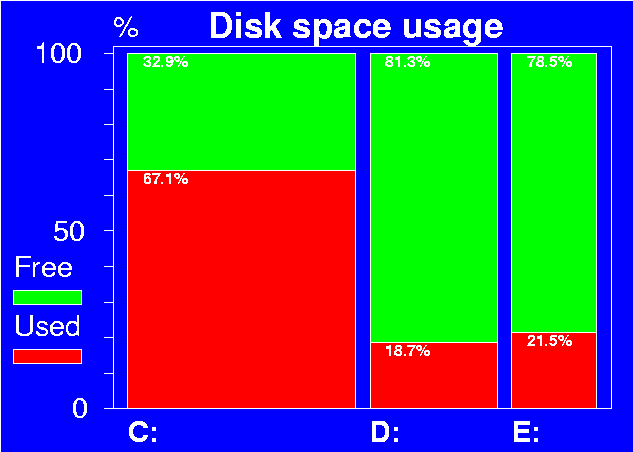
   2 */FREEDISK / gives the data and a ready-made plot scheme:
   3 *.......................................................................
   4 *DATA FREEDISK
   5 *     Disk         Total         Used         Free
   6 *      C:    11503779328   7717253632   3786525696 (32.9%)
   7 *      D:     6420872192   1198066176   5222806016 (81.3%)
   8 *      E:     4268058624    918718464   3349340160 (78.5%)
   9 *
  10 *GPLOT FREEDISK                    / activate this to create a bar chart
  11 *                              VALUES=[SwissB(12)],###.#%,-.5 VALUEMIN=5
  12 *                        VARS=Disk,Used,Free TYPE=%AVBAR GAP=0.1,0.1,0.1
  13 *                  PEN=[Swiss(18)] LINETYPE=[WHITE] NAMES=[SwissB(20)],1
  14 *                LEGEND=10,80,1 LEGEND_TEXT=0,10 LEGEND_BOX=100,40,40,10
  15 *          YSCALE=0,10:_,20:_,30:_,40:_,50,60:_,70:_,80:_,90:_,100,102:?
  16 *      XDIV=20,125,5 YDIV=1.5,12,1.5 COLORS=[/BLUE] SHADING=1,2 YLABEL=%
  17 *HEADER=[SwissB(25)],___________________________________Disk_space_usage
  18 *.......................................................................
  19 *
  20 *
Index | Catalog | Previous | Next