Environment for creative processing of text and numerical data |  |
(continued from previous example)
  32 *
  33 *........................................................................
  34 *
  35 *GHISTO BSIMUL,X,CUR+1 / X=-0.5(1)13.5 FIT=Bin(13,1/3)
  36 *
  32 *
  33 *........................................................................
  34 *
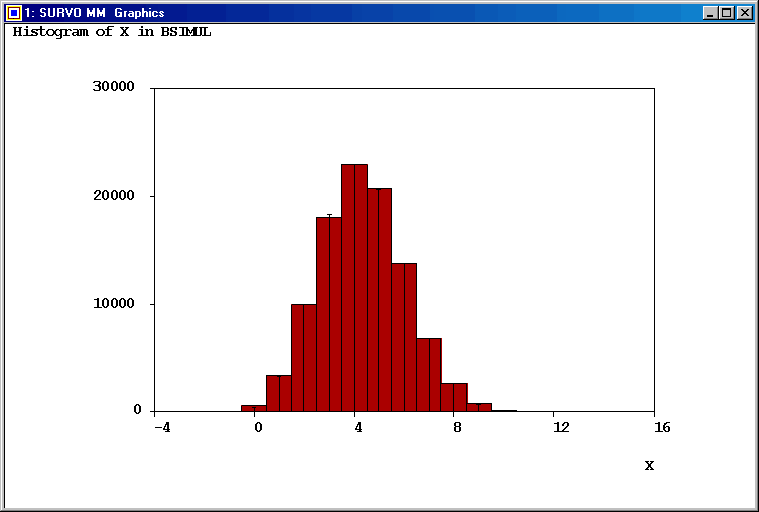
  35 *GHISTO BSIMUL,X,CUR+1 / X=-0.5(1)13.5 FIT=Bin(13,1/3)
  36 *Frequency distribution of X in BSIMUL: N=100000
  37 *
  38 *Class midpoint    f     %     Sum     %       e        e      f     X^2
  39 *         0.0    522   0.5     522   0.5   513.8    513.8    522     0.1
  40 *         1.0   3462   3.5    3984   4.0  3339.9   3339.9   3462     4.5
  41 *         2.0   9957  10.0   13941  13.9 10019.6  10019.6   9957     0.4
  42 *         3.0  18100  18.1   32041  32.0 18369.2  18369.2  18100     3.9
  43 *         4.0  22989  23.0   55030  55.0 22961.5  22961.5  22989     0.0
  44 *         5.0  20749  20.7   75779  75.8 20665.3  20665.3  20749     0.3
  45 *         6.0  13832  13.8   89611  89.6 13776.9  13776.9  13832     0.2
  46 *         7.0   6841   6.8   96452  96.5  6888.4   6888.4   6841     0.3
  47 *         8.0   2595   2.6   99047  99.0  2583.2   2583.2   2595     0.1
  48 *         9.0    785   0.8   99832  99.8   717.5    717.5    785     6.3
  49 *        10.0    145   0.1   99977 100.0   143.5    143.5    145     0.0
  50 *        11.0     21   0.0   99998 100.0    19.6
  51 *        12.0      2   0.0  100000 100.0     1.6
  52 *        13.0      0   0.0  100000 100.0     0.1     21.3     23     0.1
  53 *Mean=4.337860 Std.dev.=1.706432
  54 *Fitted by BIN(13,0.3333) distribution
  55 *Chi-square=16.40 df=11 P=0.1268
  56 *
  57 *At least 10 successes in 13 trials occurs 145+21+2=168 times, and thus
  58 *their proportion is 168/N=0.00168
  59 *This corresponds to the theoretical probability (see the next example).
  60 *
