Environment for creative processing of text and numerical data |  |
S.Mustonen (2004)

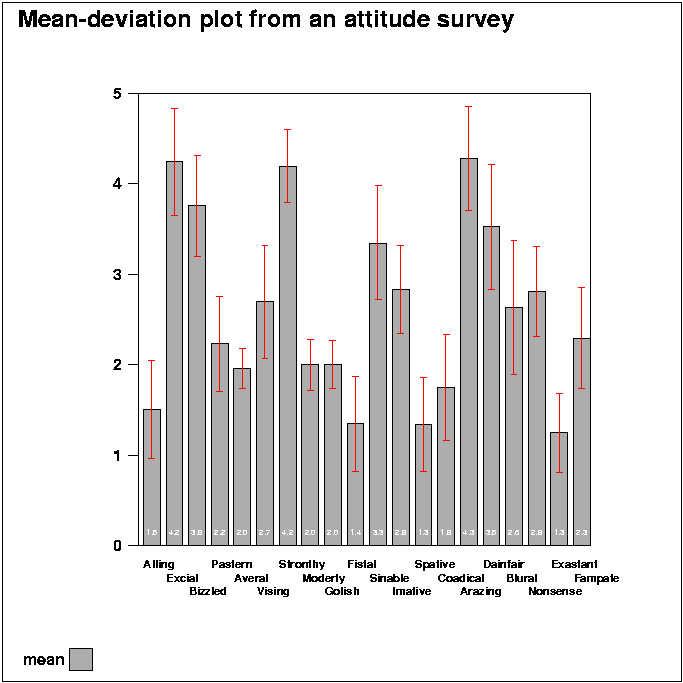
1 * 2 *Mean-deviation plots are often used for studying results of 3 *attitude surveys. A suitable PLOT scheme for such graphs is created 4 *by a sucro command 5 * 6 */DEVPLOT <data>,<type> 7 * 8 *where <type> is either VBAR or HBAR. The user may enhance the 9 *scheme afterwards according to his/her own requirements. 10 * 11 *The data of 20 variables and 300 observations from an attitude survey 12 *have been generated at random by an |EXAMPLE| sucro, which demonstrates 13 *how to make typical mean-deviation plots. 14 * 15 *....................................................................... 16 * 17 *VARS=ALL / Selecting variables 18 * 19 *Making the mean-deviation graph by the /DEVPLOT sucro: 20 */DEVPLOT ATTITUDE,VBAR21 *MINSTAT ATTITUDE / saves basic statistics in matrix file STAT.M . 22 *FILE DEL _STATM 23 *FILE SAVE MAT STAT.M TO _STATM / basic statistics to a data file. 24 *up=mean+stddev down=mean-stddev 25 *VAR up,down TO _STATM / computes variables according to above formulas. 26 * 27 *'up' and 'down' variables may be computed also by other formulas. 28 * 29 *PLOT _STATM/ TYPE=VBAR VARS=CASE,mean SHADING=2 YSCALE=0(1)5 30 *DEV=[RED],down,up (specifying extra line segments in the graph) 31 *NAMES=[Swissb(7)],3,30 (bar labels on 3 lines with line spacing 30) 32 * 33 *PEN=[BLACK][Swissb(10)][MOVE(0,0)] DEVICE=PS,K.PS 34 *VALUES=[MOVE(-5,0)][Swiss(5)][WHITE],#.#,2 35 *HEADER=[Swissb(15)],Mean-deviation_plot_from_an_attitude_survey 36 * 37 */GS-PDF K.PS/ Showing the picture by Ghostscript and Acrobat Reader 38 *
Index | Catalog | Previous | Next