Environment for creative processing of text and numerical data |  |
K.Vehkalahti (2002)

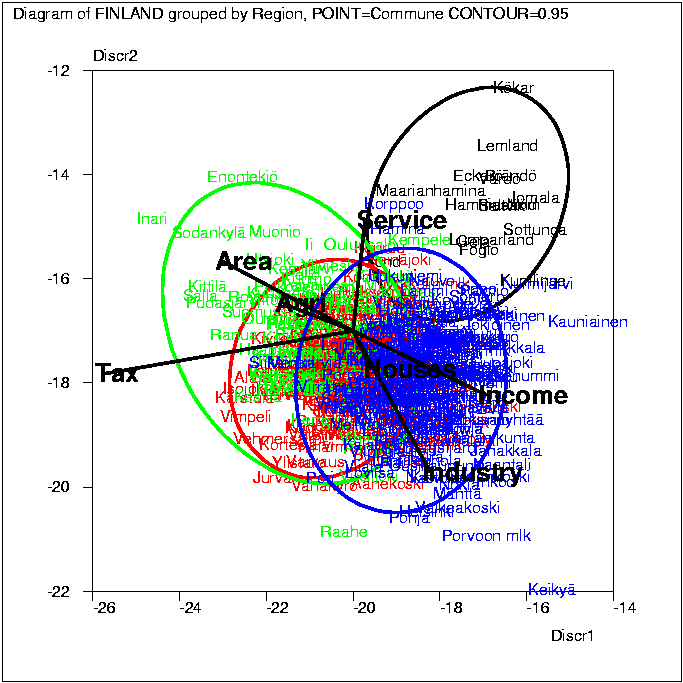
1 *SAVE FINLAND / Discriminant analysis of Finland 2 * 3 *>COPY <Survo>\U\D\FINLAND.SVO 4 *FILE SHOW FINLAND/ 464 communes of Finland (data from 1978) 5 * 6 *Defining the regions in the data: 7 * 8 *CLASSIFY FINLAND,REGIONS,Province,Region9 *CLASSIFICATION REGIONS 10 *UUS,TUR,HÄM,KYM: Southern 11 *MIK,KAR,KUO,KES,VAA: Middle 12 *OUL,LAP: Northern 13 *AHV: Archipelago 14 *END 15 * 16 *........................................................................ 17 * 18 *Selection of variables: 19 *MASK=----AAAAAAA- 20 * 21 *FILE STATUS FINLAND/ Variable descriptions: 22 * The Finnish towns and communes in alphabetic order 23 * Data mainly from years 1978-80. 24 * COND:FINLAND 25 *FIELDS: (active) 26 * 5 NA- 8 Area Land area square km in 1979 (######.##) 27 * 6 SA- 1 Agri Population in agriculture (10%) 28 * 7 SA- 1 Industry Population in industry (10%) 29 * 8 SA- 1 Service Population in other occupations (10%) 30 * 9 NA- 4 Houses New houses and apartments in 1978 (######) 31 * 10 NA- 4 Tax Communal tax rate in 1979 (##.##) 32 * 11 NA- 2 Income Income per inhabitant in 1979 (######) 33 *END 34 *Survo data file FINLAND: record=128 bytes, M1=30 L=64 M=14 N=464 35 * 36 *Groupwise means, standard deviations and correlations: 37 * 38 *CORR FINLAND/ CASES=Region:Southern 39 *MAT M1=MSN.M/ *M1~MSN(FINLAND) 7*3 40 *MAT R1=CORR.M/ *R1~R(FINLAND) S7*7 41 *CORR FINLAND/ CASES=Region:Middle 42 *MAT M2=MSN.M/ *M2~MSN(FINLAND) 7*3 43 *MAT R2=CORR.M/ *R2~R(FINLAND) S7*7 44 *CORR FINLAND/ CASES=Region:Northern 45 *MAT M3=MSN.M/ *M3~MSN(FINLAND) 7*3 46 *MAT R3=CORR.M/ *R3~R(FINLAND) S7*7 47 *CORR FINLAND/ CASES=Region:Archipelago 48 *MAT M4=MSN.M/ *M4~MSN(FINLAND) 7*3 49 *MAT R4=CORR.M/ *R4~R(FINLAND) S7*7 50 * 51 *........................................................................ 52 * 53 *Discriminant analysis: 54 * 55 * MSN=M1,M2,M3,M4 (matrices of means and standard deviations) 56 *CORR=R1,R2,R3,R4 (correlation matrices) 57 */DISCRI58 * Eig.val. % Can.corr Chi^2 df P 59 * 1 1.258817 68.80 0.746519 596.5672 21 1 60 * 2 0.431721 23.60 0.549126 223.7773 12 1 61 * 3 0.139117 7.60 0.349467 59.5910 5 0.9999 62 * 63 *MAT LOAD DISCRL.M,END+2 / Discriminant coefficients 64 *MAT LOAD DISCRXR.M,END+2/ Correlations variables/discriminators 65 *Correlations, means and standard deviations of discriminators 66 *for each of the 4 groups are saved in matrix files corresponding 67 *to CORR and MSN files with their names preceded by letter `D'. 68 *Discriminant scores are computed by 69 *LINCO <data_file>,DISCRL.M(D1,D2,...) 70 * 71 *MATRIX DISCRXR.M 72 *Correlations_between_variables_and_discriminators 73 */// Discr1 Discr2 Discr3 74 *Area -0.49760 0.26747 0.70962 75 *Agri -0.26769 0.10475 -0.49311 76 *Industry 0.29787 -0.54395 0.43046 77 *Service 0.04602 0.42350 0.21899 78 *Houses 0.07194 -0.14805 0.18965 79 *Tax -0.95820 -0.16350 -0.20063 80 *Income 0.51394 -0.24681 0.31122 81 * 82 *Computing and saving discriminant variables 1 and 2: 83 * 84 *LINCO FINLAND,DISCRL.M(Discr1,Discr2)85 * 86 *........................................................................ 87 * 88 *Illustration of the discriminant space:89 * 90 *MASK=----AAAAAAA-XY 91 */DCONTOUR FINLAND Region/ POINT=Commune 92 * 93 *........................................................................ 94 * 95 *The /DCONTOUR sucro automatically combines several PLOT operations 96 *and gives the user a ready made work scheme (a whole edit field), 97 *where parameters can be modified and the graph re-produced and 98 *saved in a Windows metafile or a PostScript file. 99 * 100 *
Index | Catalog | Previous | Next