Environment for creative processing of text and numerical data |  |
S.Mustonen (1996)

   1 *
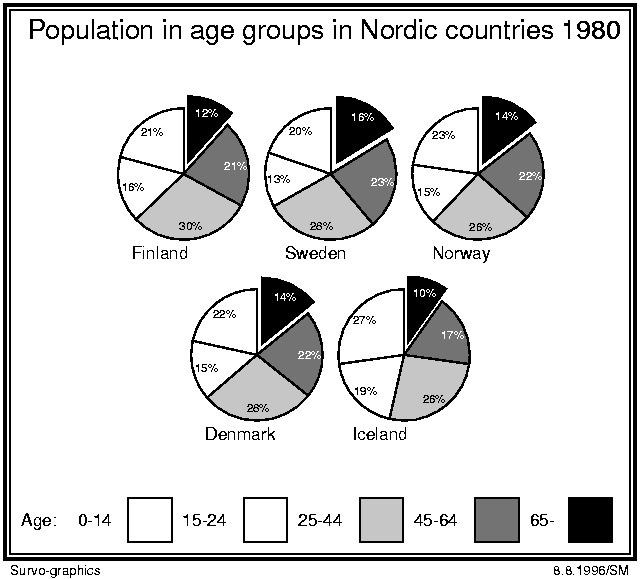
   2 *DATA NORDIC
   3 * Country  0-14 15-24 25-44 45-64   65-
   4 * Finland   990   780  1420  1015   555
   5 * Sweden   1641  1117  2316  1883  1345
   6 * Norway    925   617  1041   895   588
   7 * Denmark  1102   753  1433  1099   724
   8 * Iceland    61    43    59    39    22
   9 *
  10 *PLOT NORDIC / TYPE=%PIE DEVICE=PS,EX.PS
  11 *HEADER=[Swiss(14)],Population_in_age_groups_in_Nordic_countries_1980
  12 *SIZE=1140,1000 PEN=[Swiss(9)][autom_color(0)] LINETYPE=[line_width(1)]
  13 *SHADING=0,1,2,5,9P (P means pulling out the sector)
  14 *ANGLE=90 (start angle of first sector)
  15 *VALUES=[Swiss(6)][autom_color(0.6)],##%,8
  16 *XDIV=1,5,1 YDIV=1.5,5,1
  17 *LEGEND=Age:
  18 *FRAMES=F1,F2   F1=0,0,1140,1000,1
  19 *               F2=[line_width(2)],-10,-10,1160,1020
  20 *TEXTS=T1,T2    T1=[Swiss(7)],Survo-graphics,0,-40
  21 *               T2=[Swiss(7)],8.8.1996/SM,1000,-40
  22 *
Index | Catalog | Previous | Next