Environment for creative processing of text and numerical data |  |
K.Vehkalahti (1999)

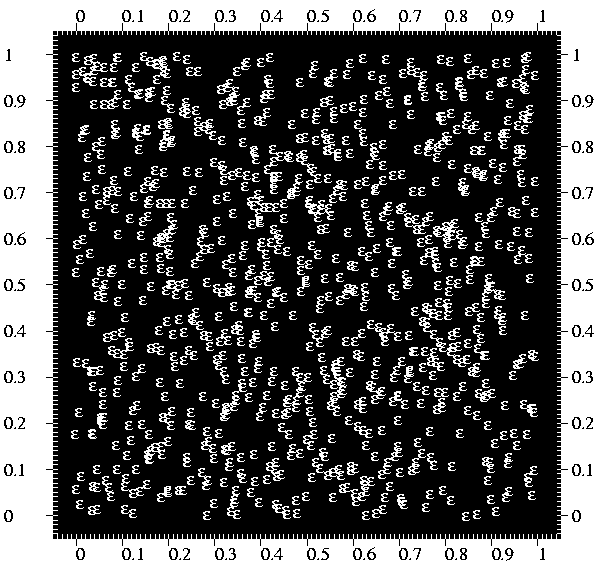
1 * 2 *Assume that SIZE=1800,1800 where plotting area=1400 and edge=200 . 3 *Then set XDIV=edge,area,edge as well as YDIV=edge,area,edge . 4 *Now let m=999 and R=rand(m) . Initialize a (m x 2) null matrix A by 5 *MAT A=ZER(m,2)/ and generate (pseudo) random observations to it by 6 *MAT #TRANSFORM A BY R/ 7 * Finally plot the observations as a scatter plot by 8 *PLOT A.MAT 1 2/ using PEN=[Times(14)] and POINT=[WHITE][SYMBOL],e 9 *Other specifications are the following: 10 *HEADER= XLABEL= YLABEL= FRAMES=F F=edge,edge,area,area,-1 FRAME=1 11 *SCALE=-0.05:?_,0(0.1)1,1.05:?_ TICK=[WHITE],0.01,0.01 [FILL-1]=0,0,0,1 12 *DEVICE=PS,EX.PS XSCALE2=XSCALE YSCALE2=YSCALE TICK2=TICK 13 *
Index | Catalog | Previous | Next