Environment for creative processing of text and numerical data |  |
S.Mustonen (1990)

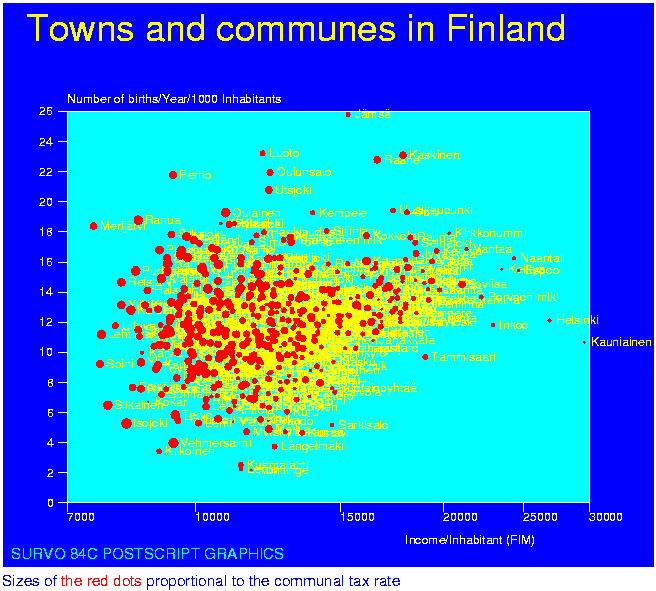
1 * 2 *VAR Brthrate=1000*Births/Popul TO FINLAND / *GLOBAL* 3 * 4 *HOME=200,500 SIZE=1500,1300 XDIV=150,1200,150 YDIV=150,900,250 5 *XSCALE=*log(x),7000,10000(5000)30000 XLABEL=Income/Inhabitant_(FIM) 6 *YSCALE=0(2)26 YLABEL=Number_of_births/Year/1000_Inhabitants 7 *PEN=[WHITE][Swiss(8)] LINETYPE=[WHITE] 8 *....................................................................... 9 *HEADER=[Swiss(24)][YELLOW],Towns_and_communes_in_Finland 10 *VAR str(Commune2)="___"&str(Commune) TO FINLAND 11 *PLOT FINLAND,Income,Brthrate/ DEVICE=PS,FINLAND1.PS 12 *POINT=[YELLOW][Swiss(8)],Commune2 13 *FRAMES=F1,F2 F1=0,0,1500,1300,-1 F2=150,150,1200,900,-2 14 *[FILL-1]=1,1,0,0 [FILL-2]=1,0,0,0 15 *....................................................................... 16 *HEADER= 17 *VAR Taxdiff=Tax-13 TO FINLAND 18 *PLOT FINLAND,Income,Brthrate/ DEVICE=PS,FINLAND2.PS 19 *POINT=[RED],0,15,Taxdiff,7 20 *TEXTS=T1 T1=[SWISS(10)][CYAN],SURVO_84C_POSTSCRIPT_GRAPHICS,20,20 21 * 22 *....................................................................... 23 * 24 *PRINT CUR+1,E25 - shadow r: [RED] 26 - shadow b: [BLUE] 27 & 40 28 - picture FINLAND1.PS,*,* 29 - picture FINLAND2.PS,*,* 30 - [Swiss(10)][line_spacing(12)][BLUE][copies(5)] 31 * 32 *Sizes ofthe red dotsproportional to the communal tax rate 33 E 34 *
Index | Catalog | Previous | Next