Environment for creative processing of text and numerical data |  |
S.Mustonen, Survo Users' Guide (1992), pp. 264-265

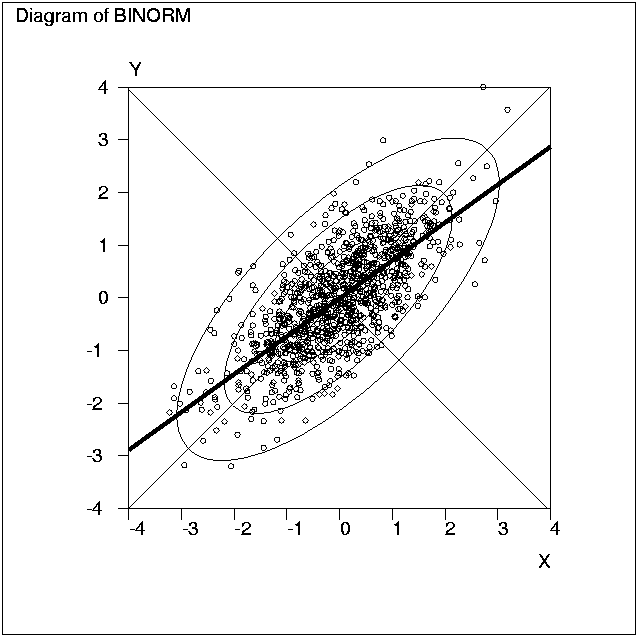
1 * 2 *FILE CREATE BINORM,8,23 *Sample of 1000 observations from a bivariate normal distribution 4 *with E(X)=E(Y)=0 S(X)=S(Y)=1 R(X,Y)=0.7 5 *FIELDS: 6 *1 N 4 X 7 *2 N 4 Y 8 *END 9 * 10 *FILE INIT BINORM,100011 * 12 *VAR X,Y TO BINORM13 *R=0.7 14 *U=probit(rnd(1)) V=probit(rnd(1)) 15 *X=U Y=R*U+sqrt(1-R*R)*V 16 * 17 *CORR BINORM,CUR+118 *Means, std.devs and correlations of BINORM N=1000 19 *Variable Mean Std.dev. 20 *X -0.023622 1.008356 21 *Y -0.023204 1.010290 22 *Correlations: 23 * X Y 24 * X 1.0000 0.7177 25 * Y 0.7177 1.0000 26 *....................................................................... 27 *PLOT BINORM,X,Y28 *SCALE=-4(1)4 29 *CONTOUR=[line_width(0.5)],0,0.5,0.9,0.99 30 *TREND=[line_width(2)],0 31 *SIZE=1164,1164 DEVICE=PS 32 *....................................................................... 33 *
Index | Catalog | Previous | Next